New technologies provide roadside view of pollution

When EDF embarked on our first groundbreaking air pollution study, we wanted to see just how much pollution varied within neighborhoods. Our research showed pollution can be up to eight times higher at one end of a single city block than the other. Subsequent research showed just how much these hotspots can impact residents’ health.

  • Google car methane monitoring Oakland
    Bay Area, California

    Original study: pollution varies dramatically within city blocks

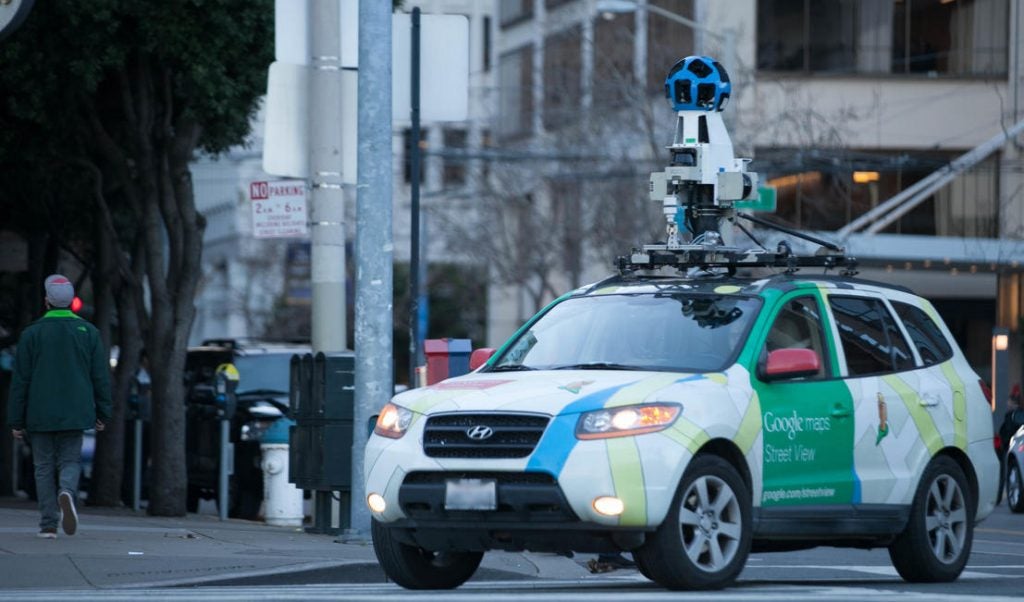
    While we already knew parts of Oakland are exposed to some of the highest levels of air pollution in the Bay Area, we wanted to create a more detailed view of local hotspots. Google Street View cars drove through sections of Oakland an average of 30 times over 30 months using instruments provided by Aclima to collect nearly 3 million unique air quality measurements.

Working with researchers from the University of Texas at Austin, Aclima and community-based environmental justice leaders at the West Oakland Environmental Indicators Project, we began to better understand air pollution hotspots in the area.

Our maps showed elevated pollution near freeways, along busy roadways and truck routes, and near industrial sources, including one near a children’s playground. Our research also found new hotspots, making these previously invisible health threats visible.

How pollution impacts health in West Oakland

Researchers from EDF and the University of Texas at Austin took our data to the West Oakland Environmental Indicators Project (WOEIP), a community-based organization with recognized leadership in local air pollution issues, to learn more about potential sources of poor air quality.

Explore: Interactive map and points of interest

Air pollution and health in East Oakland

EDF deployed Google Street View cars equipped with Aclima's environmental sensing platform to collect data in a 6 square mile area in the easternmost part of Oakland for a year between 2015 and 2016. The resulting map shows elevated levels of air pollution in many parts of East Oakland.

Explore: Interactive map and points of interest

Stationary study: 24-hour monitoring shows how pollution changes over time

Like traffic, pollution ebbs and flows through the day, yet we’re unable to see it. To better understand how pollution changes over space and time, EDF and our partners installed 100 black carbon sensors across West Oakland and continuously collected data for 100 days. The team’s tool shows just how much pollution patterns change depending on time and location.

This research revealed how much pollution can spike when trucks idle outside the Port of Oakland, how they ebb during a lunch break and how a busy stoplight and heavy traffic can cause a significant hotspot. The tool also shows just how much refrigeration systems at a trucking facility pollute a nearby park during nighttime hours.

Health analysis: health records and pollution data shows impacts on elderly

EDF partnered with Kaiser Permanente to combine data from our original study with the electronic health records of 41,000 people in Oakland to better understand just how much place matters in driving health disparities.

We found that for people age 65 and over, higher concentrations of nitrogen dioxide (NO2) and black carbon (BC) on the streets outside their homes were associated with an increased risk of having a heart attack, heart surgery and/or dying due to coronary heart disease.

The study, which includes detailed maps (above) points to new ways we can use big data to ultimately improve human health.

Learn more about the Oakland research, our partners and view the maps, download the data and more at our comprehensive project pages.

Tags: