Road transportation is a major source of air pollution in London, with heavy goods vehicles one of the top contributors of pollutants that harm people’s health.
The thinktank, Centre for London, has been conducting research this year to look “at how we can create smarter, fairer and more sustainable freight and logistics ecosystems.”
Centre for London was keen to understand more about freight activity in London, like daily activity patterns and how it was affected by COVID-19 lockdowns in the last year. These questions aren’t easy to answer with publicly available data sources. Using supportive traffic and congestion datasets, we were able to produce an analysis that provides a closer look at freight across the capital city – and a special focus on a particular neighbourhood in South London to get a more granular picture.
Here’s what we found.
Zooming in on one area
Based on modelled data produced by Cambridge Environmental Research Consultants (CERC) for the Breathe London pilot, we estimate that heavy goods vehicles are responsible for 15% of total nitrogen dioxide concentrations from road transport – despite the fact these vehicles are responsible for just 4% of kilometres driven on London’s roads.
To better understand how these heavier freight vehicles operate, Centre for London identified Old Kent Road in London’s borough of Southwark as an ideal case study area because of its diverse mix of local businesses and range of retail and commercial premises all alongside residential areas. Specifically, we sought to find out what times of day or days of the week are freight vehicles using the road, and are they responding to locally generated demand (e.g., delivering goods to a local store) or if they are passing through on their way to somewhere else.
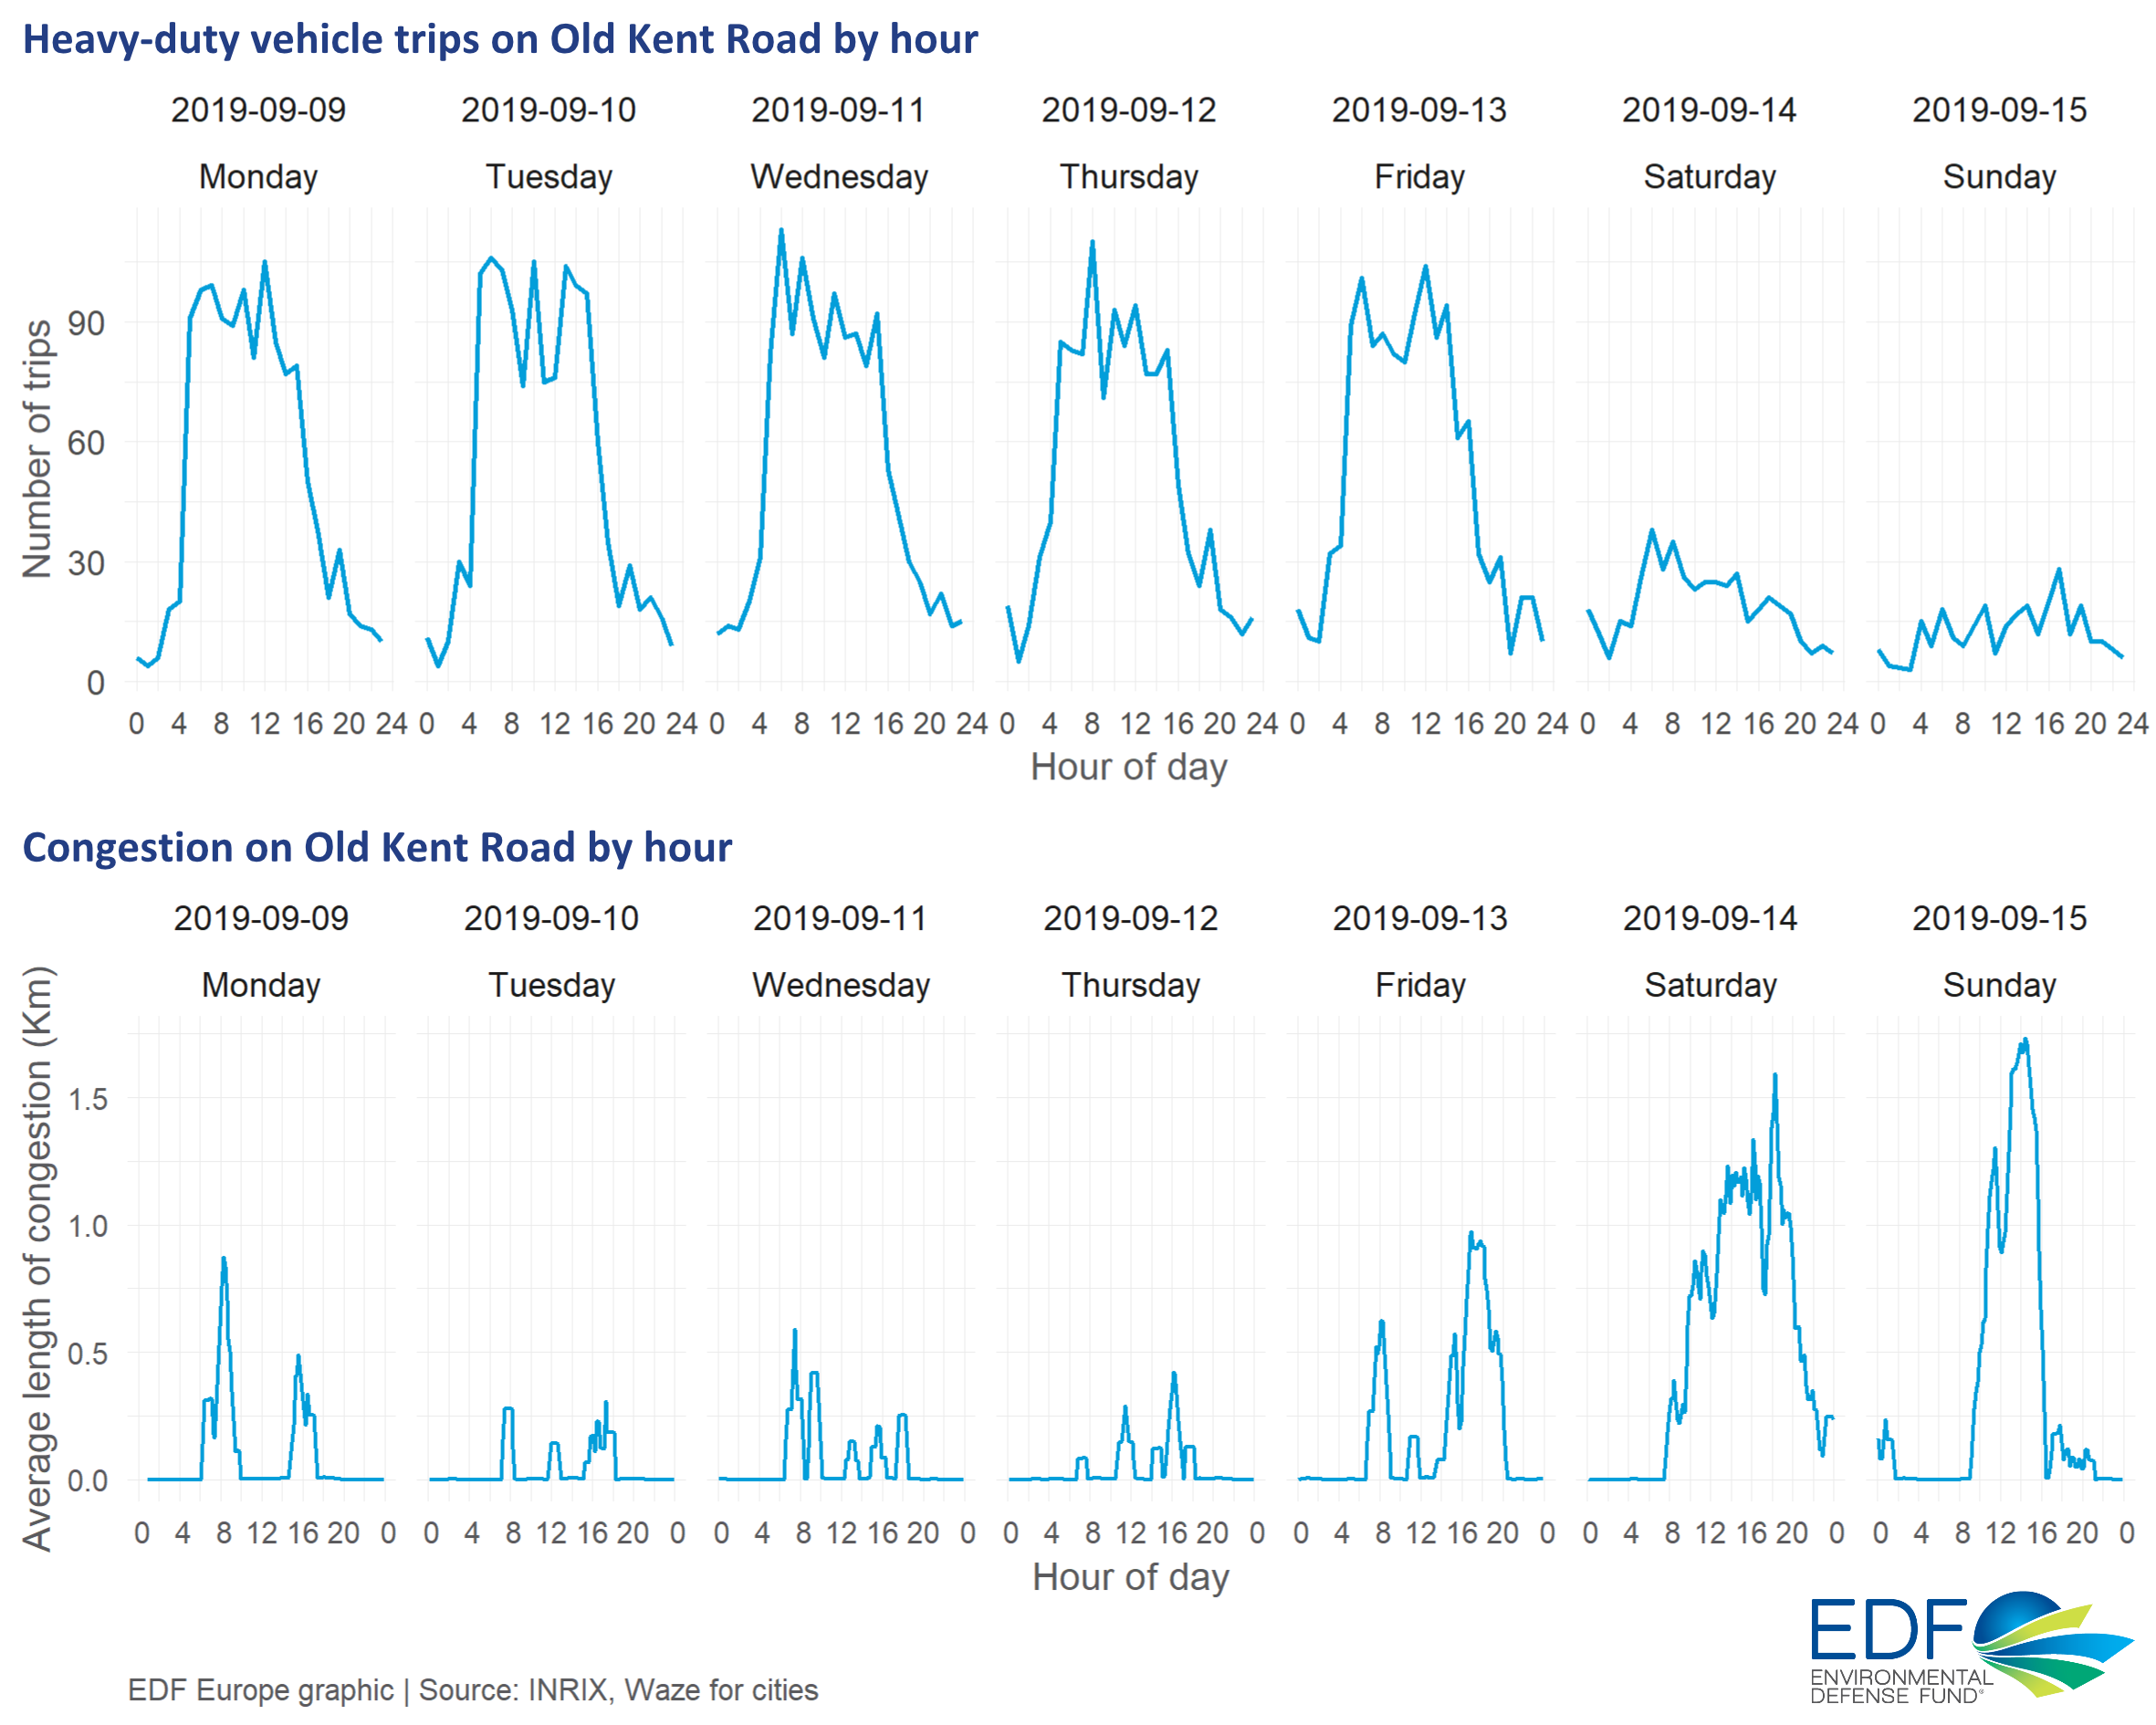
We looked at a traffic dataset acquired from INRIX[1], which included trip details of heavy-duty freight vehicles travelling through London during a sample week in September 2019 and the same calendar week in 2020. We began by identifying over 7,000 freight trips that crossed Old Kent Road during the sample week. We also looked at traffic congestion for all vehicle types using anonymous data from the Waze for Cities Program[2] for the same weeks so that we could better understand the typical driving conditions during the heavy-duty freight vehicle trips.
Looking at Old Kent Road trip data from the sample week in September 2019, daily heavy-duty freight vehicle activity showed that trips start early in the day, peaking at 05:00 and staying high until 15:00 on weekdays. The congestion data (for all vehicle types) during the same period on Old Kent Road, reveals that there is no clear relationship between freight movements and congestion. However, it does highlight the times when heavy-duty freight vehicles likely to be stuck in traffic; and, as these vehicles produce more pollution than most passenger cars, the pollution they produce due to congestion is greater.
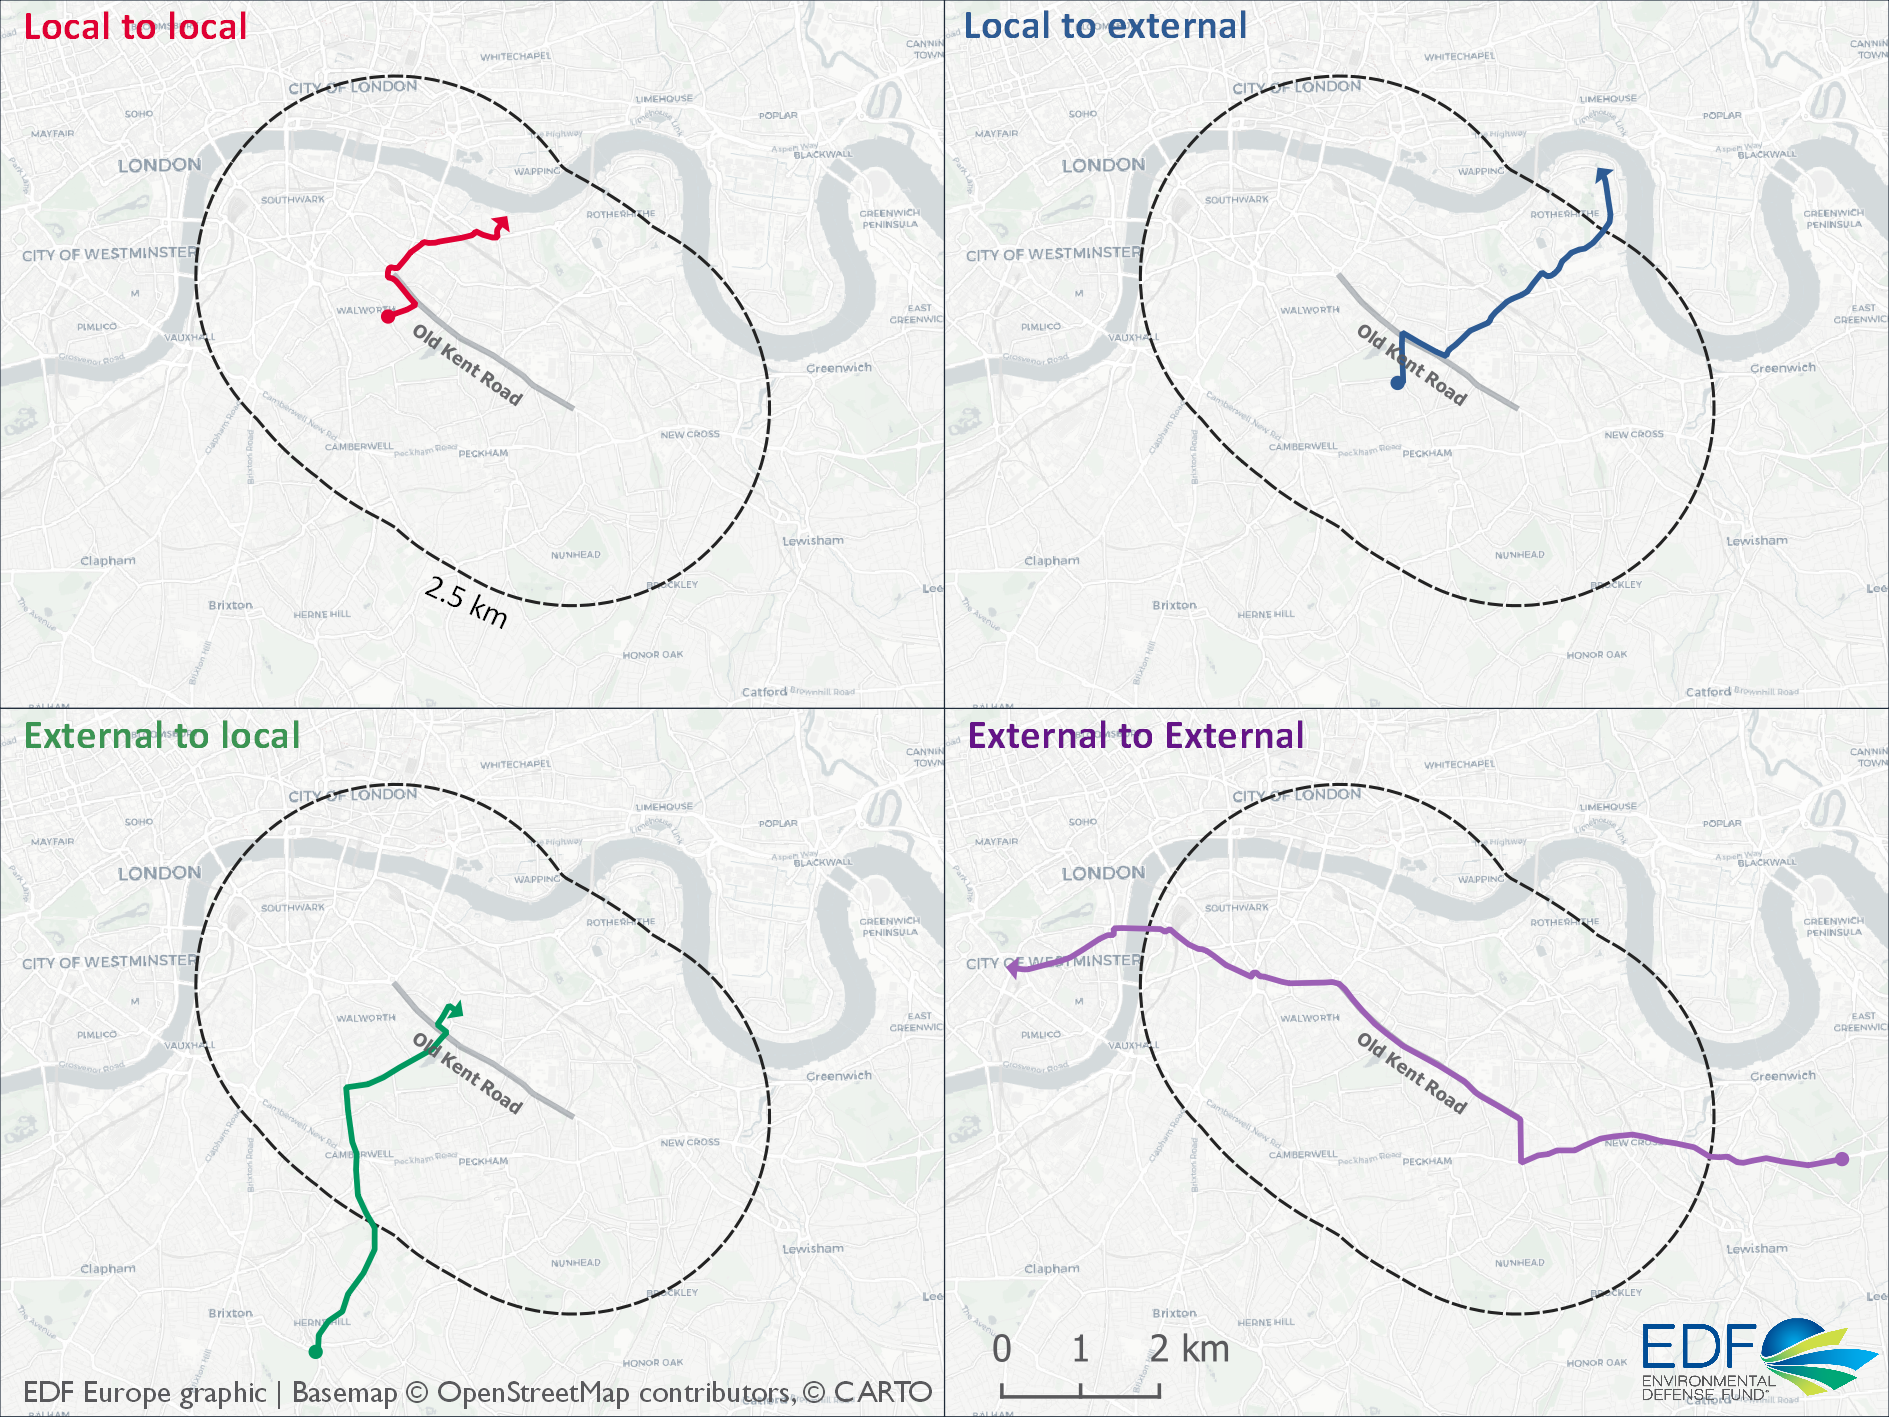
In order to understand the type of demand that these trips were responding to, we examined the distance of trip origins and destinations from Old Kent Road and were able to establish four distinct types of trips:
- Local to local: Trips that started and ended within 2.5 kilometre (km) of Old Kent Road
- External to local: Trips that started beyond and ended within 2.5 km
- Local to external: Trips that started within 2.5 km and ended beyond
- External to external: Trips that both started and ended beyond 2.5 km
This classification revealed that almost three-quarters of freight journeys on Old Kent Road had an origin or destination in the local area (within 2.5 km); nearly a quarter started and ended locally.
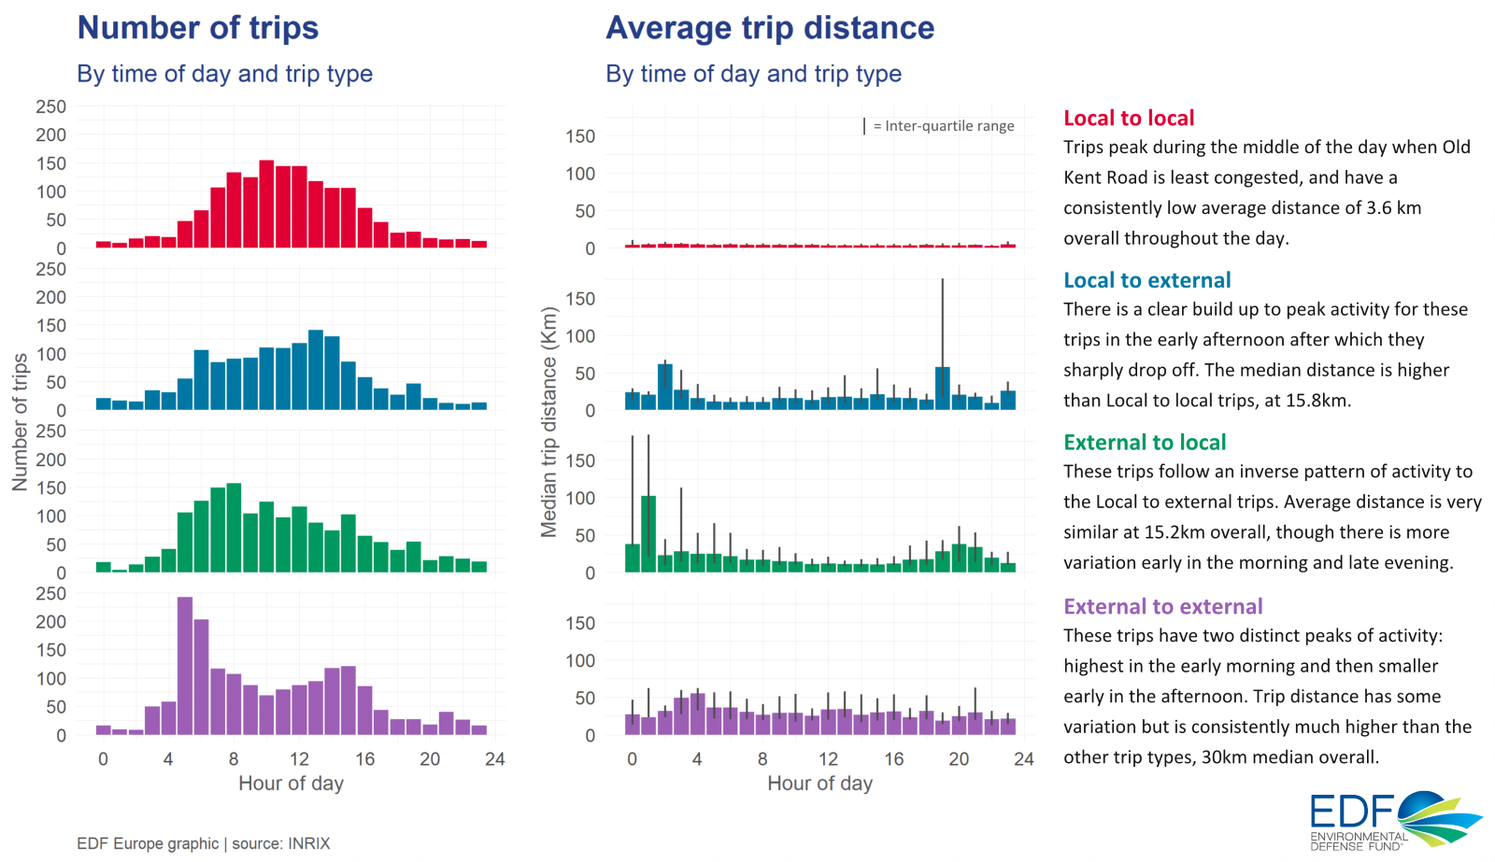
Each of the four different trip types showed distinctive behavior in terms of the trip time and distance travelled. Click on the image to get more detail on each.
We also examined pollution sources data, which showed that heavy goods vehicles contribute over 20% of nitrogen oxides pollution from road transport in the area.
London-wide findings
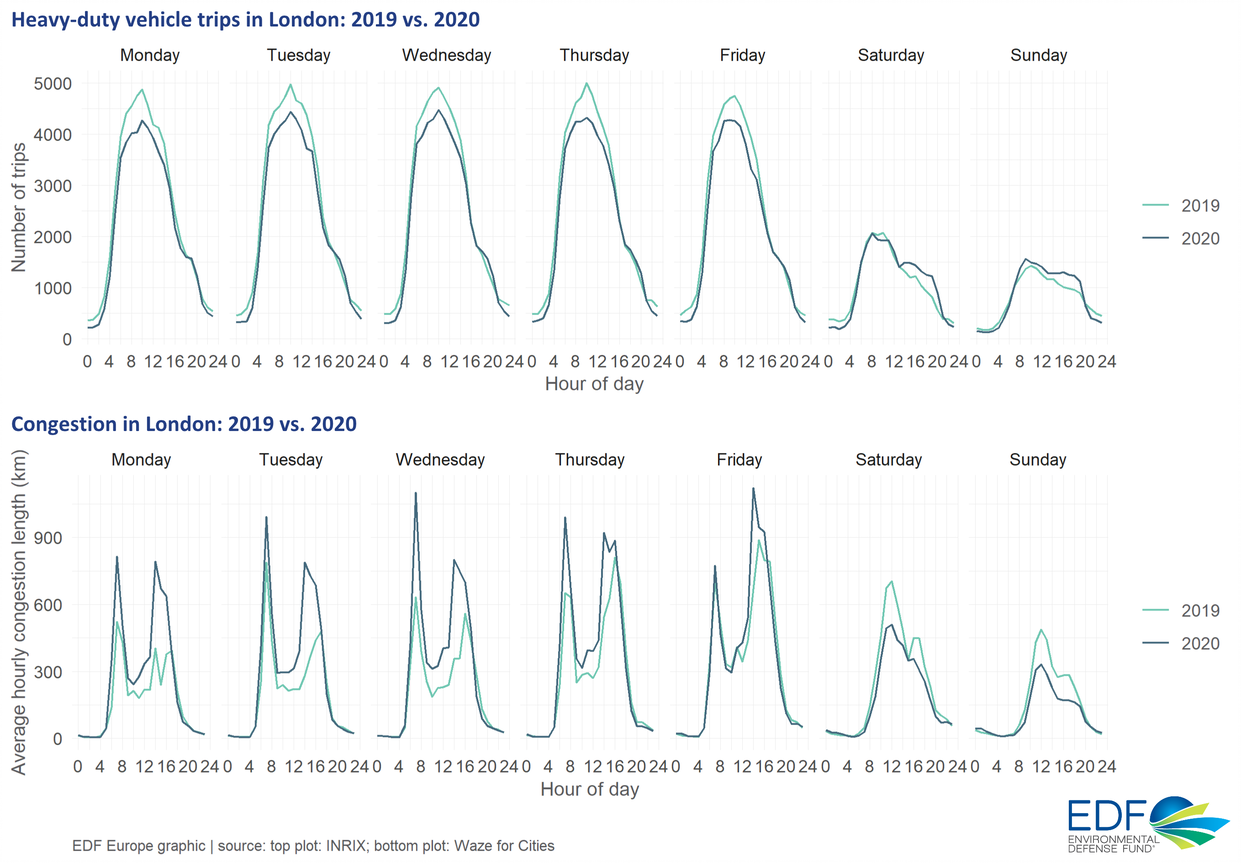
We also sought to understand the effect COVID-19 restrictions had on freight traffic across the city. We compared daily activity between the September week in 2019 and 2020, as well as making the same comparison for overall road congestion in London.
For heavy duty vehicles, we observed lower numbers of trips throughout the day in 2020 compared to 2019. But for congestion this pattern is reversed, with 2020 levels of congestion spiking far above those observed in 2019.
Interestingly, for all vehicle congestion, the year-on-year change observed during weekdays is reversed on the weekend. Heavy duty vehicle activity is lower in 2020 (compared to 2019) during weekdays but higher on the weekends, while congestion is higher in 2020 than 2019 during weekdays and lower on the weekends. Analysis of additional information would be necessary to better understand why these trends occurred.
We hope our findings will enable Centre for London to better understand vehicle activity in the area and advocate for targeted policy and business solutions that reduce pollution and improve health.
You can find the Centre for London report on freight here and the complete analysis EDF Europe provided here.
[1] Data was procured from INRIX. INRIX has no affiliation with the analysis or results
[2] Data provided from the Waze for Cities Program by permission